[]
[]
Printing can have negative environmental impacts due to paper waste. We encourage you to explore eco-friendly alternatives. Bookmarking this page in your browser allows you to access it anytime.
This publication can also be converted to PDF, if you have a PDF printer installed on your computer. PDF printers function as virtual printers, enabling you to create digital copies of web pages and access the content offline.
{ const buttonPrintPage = document.getElementById(‘estat-print-page-modal-toggle’); const cookieSkipModal = ‘skipModalBeforePrinting’; if (configuration.displayInPageHeader) { const headerElement = document.querySelector(‘.ecl-page-header .ecl-page-header__meta’) || document.querySelector(‘.ecl-page-header .ecl-page-header__title-container ‘) if (headerElement) { headerElement.prepend(buttonPrintPage); headerElement.classList.add(‘ecl-u-width-100’) } } buttonPrintPage.addEventListener(‘click’, () => { const skipModal = readCookie(cookieSkipModal); if (skipModal == ‘true’) { window.print(); } else { const eclModalElement = document.getElementById(‘estat-print-page-modal’); const eclModal = ECL.components.get(eclModalElement); eclModal.openModal(); } }); document.getElementById(‘print-submit’).addEventListener(‘click’, () => { const skipModal = document.getElementById(‘checkbox-skip-modal’).checked if (skipModal) { writeCookieWithMaxAgeValue(cookieSkipModal, ‘true’, 15768000); } else { deleteCookie(cookieSkipModal); } window.print(); }); });;}());]]>
+1.3% and +1.4% respectively compared with the fourth quarter of 2024
Overview
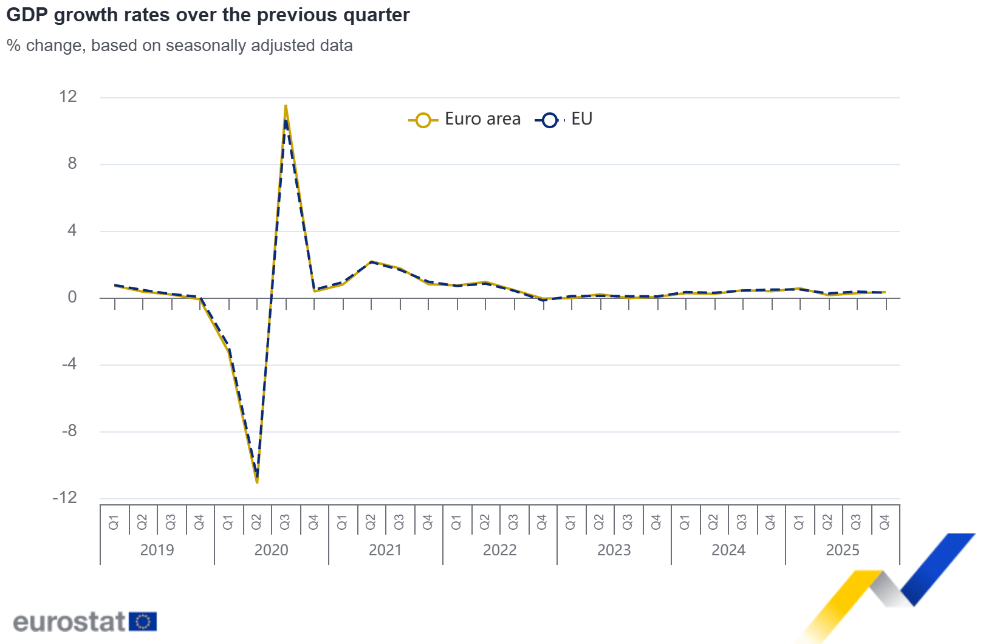
In the fourth quarter of 2025, seasonally adjusted GDP increased by 0.3% in both the euro area and the EU, compared with the previous quarter, according to a preliminary flash estimate published by Eurostat, the statistical office of the European Union. In the third quarter of 2025, GDP had increased by 0.3% in the euro area and by 0.4% in the EU.
According to an estimation of annual growth for 2025, based on quarterly seasonally and calendar adjusted data, GDP increased by 1.5% in the euro area and by 1.6% in the EU.
These preliminary GDP flash estimates are based on data sources that are incomplete and subject to further revisions.
 Compared with the same quarter of the previous year, seasonally adjusted GDP increased by 1.3% in the euro area and by 1.4% in the EU in the fourth quarter of 2025, after +1.4% in the euro area and +1.6% in the EU in the previous quarter.
 Among the Member States for which data are available for the fourth quarter of 2025, Lithuania (+1.7%) recorded the highest increase compared to the previous quarter, followed by Spain and Portugal (both +0.8%). Ireland (-0.6%) was the only Member State that recorded a decrease compared to the previous quarter. The year-on-year growth rate was positive for 14 countries and stable for one country.
Table
|
Growth rates of GDP in volume (based on seasonally adjusted* data) |
||||||||
|---|---|---|---|---|---|---|---|---|
|
Percentage change compared with the previous quarter |
Percentage change compared with the same quarter of the previous year |
|||||||
|
2025Q1 |
2025Q2 |
2025Q3 |
2025Q4 |
2025Q1 |
2025Q2 |
2025Q3 |
2025Q4 |
|
|
0.6 |
0.1 |
0.3 |
0.3 |
1.6 |
1.5 |
1.4 |
1.3 |
|
|
0.6 |
0.2 |
0.3 |
0.3 |
1.6 |
1.6 |
1.4 |
1.3 |
|
|
0.5 |
0.3 |
0.4 |
0.3 |
1.7 |
1.7 |
1.6 |
1.4 |
|
|
0.4 |
0.2 |
0.3 |
0.2 |
0.9 |
1.0 |
1.0 |
1.1 |
|
|
0.7 |
0.5 |
0.8 |
0.5 |
2.4 |
2.6 |
2.8 |
2.4 |
|
|
0.4 |
-0.2 |
0.0 |
0.3 |
0.3 |
0.4 |
0.3 |
0.4 |
|
|
0.2 |
0.6 |
0.2 |
0.0 |
-0.3 |
0.5 |
0.9 |
1.0 |
|
|
7.4 |
0.3 |
-0.3 |
-0.6 |
18.3 |
18.1 |
10.9 |
6.7 |
|
|
0.5 |
0.7 |
0.6 |
0.8 |
3.0 |
2.8 |
2.7 |
2.6 |
|
|
0.1 |
0.3 |
0.5 |
0.2 |
0.7 |
0.8 |
0.9 |
1.1 |
|
|
0.3 |
0.0 |
0.2 |
0.3 |
0.7 |
0.5 |
0.6 |
0.8 |
|
|
0.3 |
0.6 |
-0.1 |
1.7 |
3.0 |
3.2 |
2.1 |
2.5 |
|
|
-0.2 |
0.5 |
0.0 |
0.2 |
-0.3 |
0.3 |
0.7 |
0.5 |
|
|
0.3 |
0.3 |
0.5 |
0.5 |
2.2 |
1.7 |
1.8 |
1.8 |
|
|
0.2 |
0.0 |
0.4 |
0.2 |
0.3 |
0.5 |
1.0 |
0.7 |
|
|
-0.3 |
0.7 |
0.7 |
0.8 |
1.7 |
1.8 |
2.3 |
1.9 |
|
|
0.0 |
-0.3 |
-0.3 |
0.6 |
1.1 |
0.2 |
-0.6 |
0.0 |
|
|
-0.2 |
0.7 |
0.9 |
0.2 |
0.6 |
1.9 |
2.6 |
1.8 |
The next estimates for the fourth quarter of 2025 will be released on 13 February 2026.
Notes for users
Revisions
The reliability of GDP flash estimates was tested by dedicated working groups and revisions of subsequent estimates are continuously monitored. Further information can be found on Eurostat website.
With this preliminary flash estimate, euro area and EU GDP figures for earlier quarters are not revised.
All figures presented in this release may be revised with the GDP t+45 flash estimate scheduled for 13 February 2026 and subsequently by Eurostat’s regular estimates of GDP and main aggregates (including employment) scheduled for 6 March 2026 and 20 April 2026.
The preliminary flash estimate of GDP growth for the fourth quarter of 2025 presented in this release is based on the data of 19 Member States, covering 96% of euro area GDP and 94% of EU GDP.
Release schedule
Comprehensive estimates of European main aggregates (including GDP and employment) are based on countries regular transmissions and published around 65 and 110 days after the end of each quarter. To improve the timeliness of key indicators, Eurostat also publishes flash estimates for GDP (after around 30 and 45 days) and employment (after around 45 days). Their compilation is based on estimates provided by EU Member States on a voluntary basis.
This news release presents preliminary flash estimates for euro area and EU after around 30 days.
Methods and definitions
European quarterly national accounts are compiled in accordance with the European System of Accounts 2010 (ESA 2010).
Gross domestic product (GDP) at market prices measures the production activity of resident production units. Growth rates are based on chain-linked volumes.
Two statistical working papers present the preliminary GDP flash methodology for the European estimates and Member States estimates.
The method used for compilation of European GDP is the same as for previous releases.
The first estimation of annual growth for 2025 is derived by dividing the sum of the four quarters of 2025 by the sum of the four quarters of 2024. The quarterly values are expressed in millions of euro (chain-linked volumes) and include a correction for seasonal and calendar effects. The first regular estimates for annual growth in 2025 will be published on 6 March 2026.
Geographical information
Up to 31 December 2025, the euro area included Belgium, Germany, Estonia, Ireland, Greece, Spain, France, Croatia, Italy, Cyprus, Latvia, Lithuania, Luxembourg, Malta, the Netherlands, Austria, Portugal, Slovenia, Slovakia and Finland (EA20). From 1 January 2026, the euro area also includes Bulgaria (EA21).
The aggregate data series commented on in this Euro indicator release refer to the official composition of the euro area in the most recent month for which data are available. Thus, Euro indicator releases with data for months up to December 2025 comment on EA20 series, while releases with data for January 2026 onwards will comment on EA21 series.
European Union: Belgium, Bulgaria, Czechia, Denmark, Germany, Estonia, Ireland, Greece, Spain, France, Croatia, Italy, Cyprus, Latvia, Lithuania, Luxembourg, Hungary, Malta, the Netherlands, Austria, Poland, Portugal, Romania, Slovenia, Slovakia, Finland and Sweden (EU27).
For more information
Share the release
Share component will be rendered here.